前回までの作業でAzure IoT Hubにメッセージを送れているのが確認できたので, Azure IoT Hubから関数アプリ経由でAzure CosmosDBにデータを蓄積してみる。
今回はほとんどこのチュートリアル通りにする。
Azure Functions と Azure Cosmos DB を使用して非構造化データを格納する
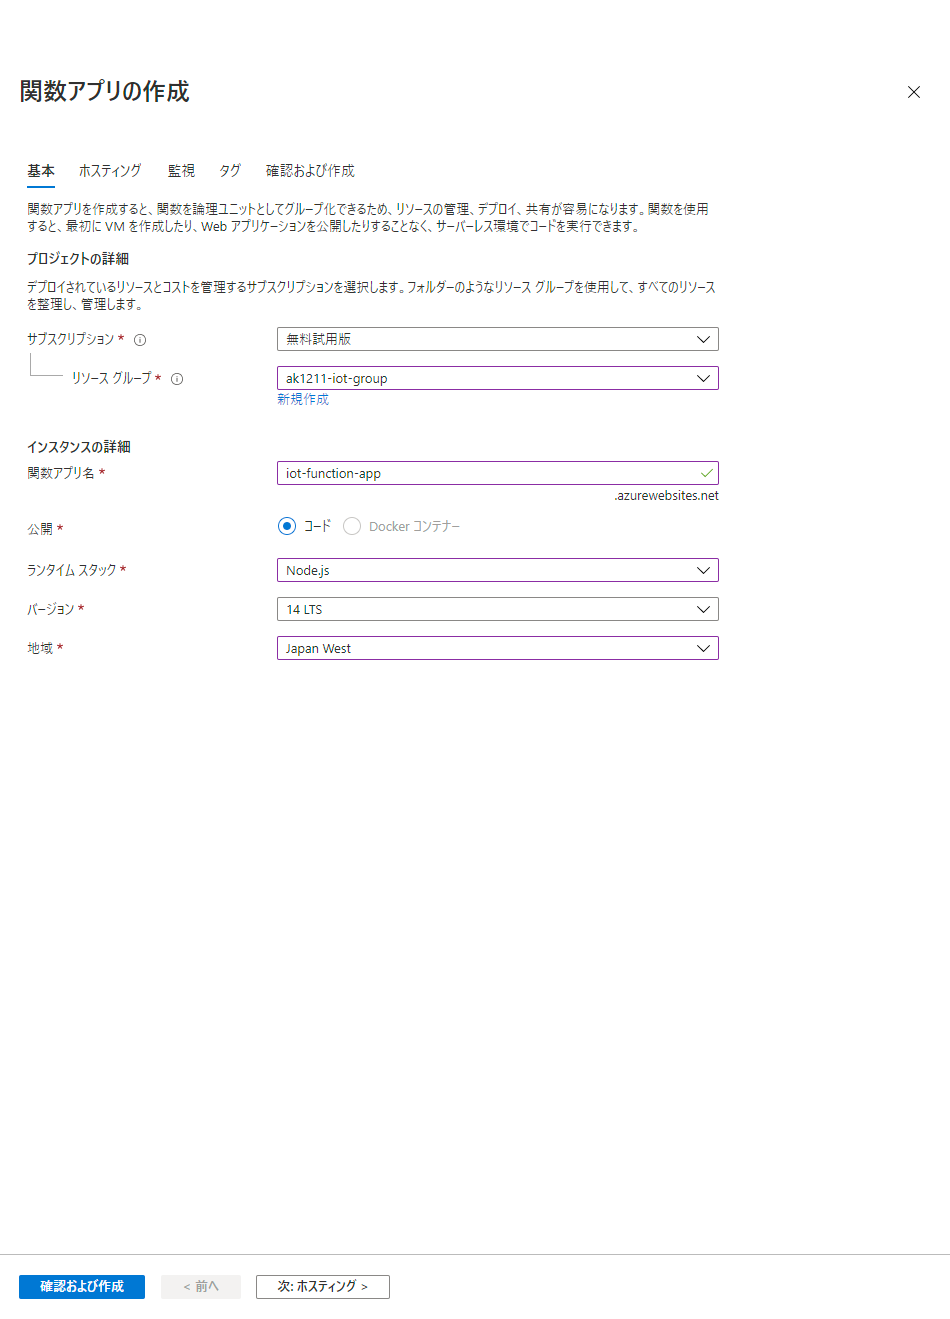
関数アプリの作成
関数の追加
Iot Hubのイベントをトリガーにする。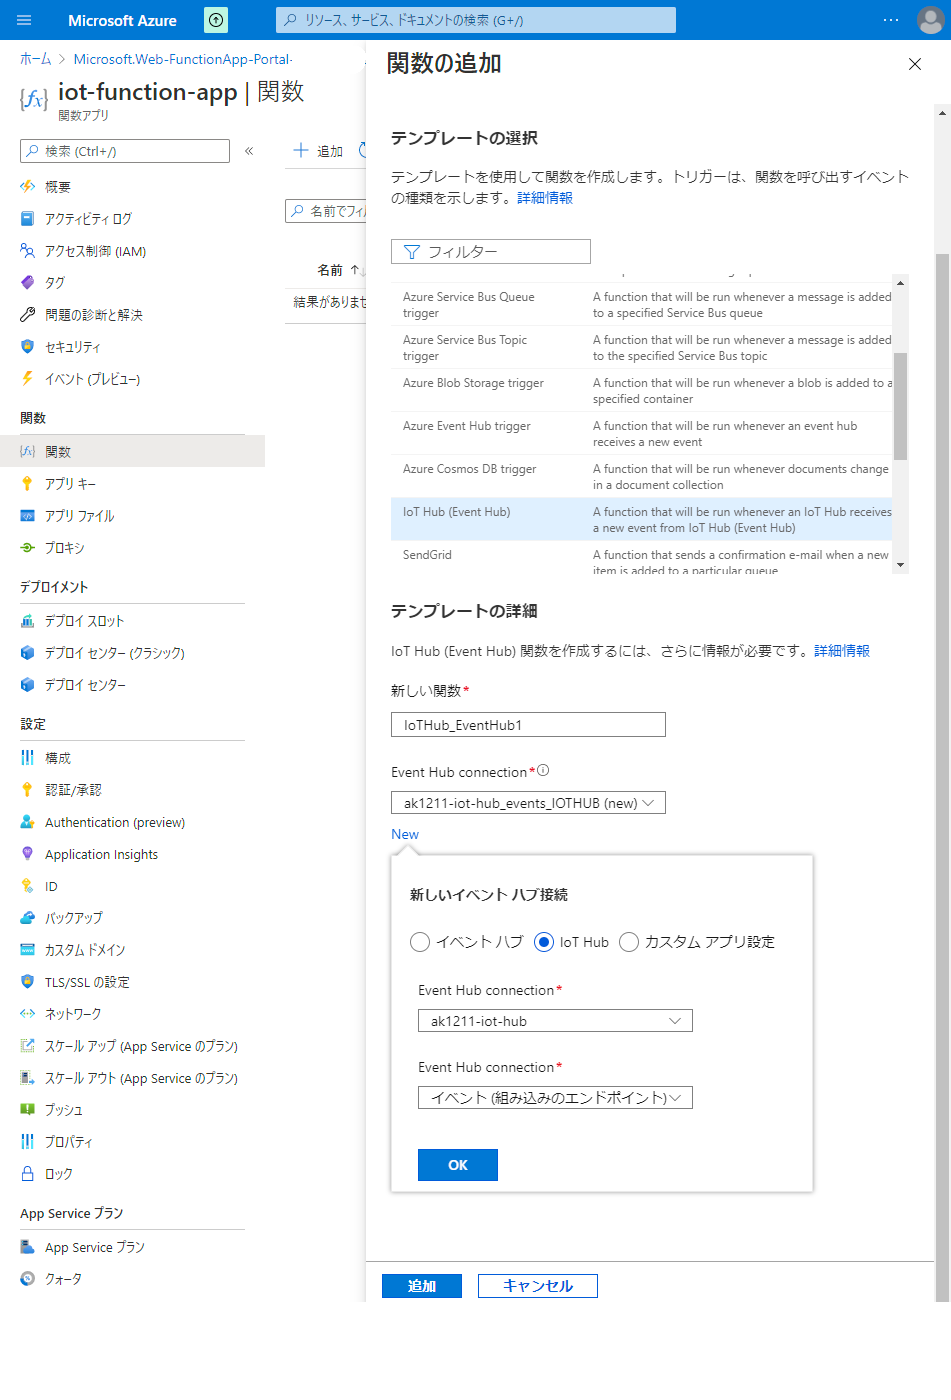
コードとテスト
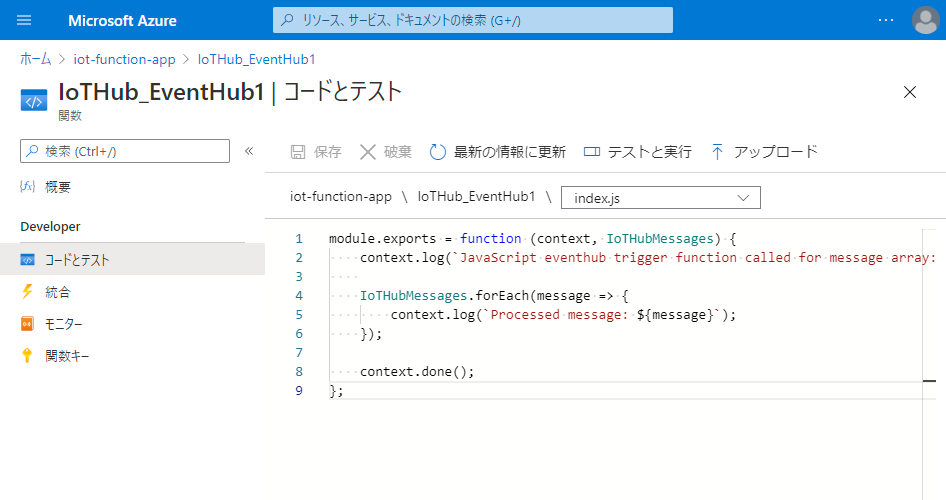
module.exports = function (context, IoTHubMessages) {
    context.log(`JavaScript eventhub trigger function called for message array: ${IoTHubMessages}`);

    IoTHubMessages.forEach(message => {
        context.log(`Processed message: ${message}`);
    });

    context.done();
};{
"bindings": [
{
"name": "IoTHubMessages",
"connection": "ak1211-iot-hub_events_IOTHUB",
"eventHubName": "iothub-ehub-ak1211-iot-xxxxxxx-xxxxxxxxxx",
"consumerGroup": "$Default",
"cardinality": "many",
"direction": "in",
"type": "eventHubTrigger"
}
]
}“eventHubName"はこの内容をペーストする。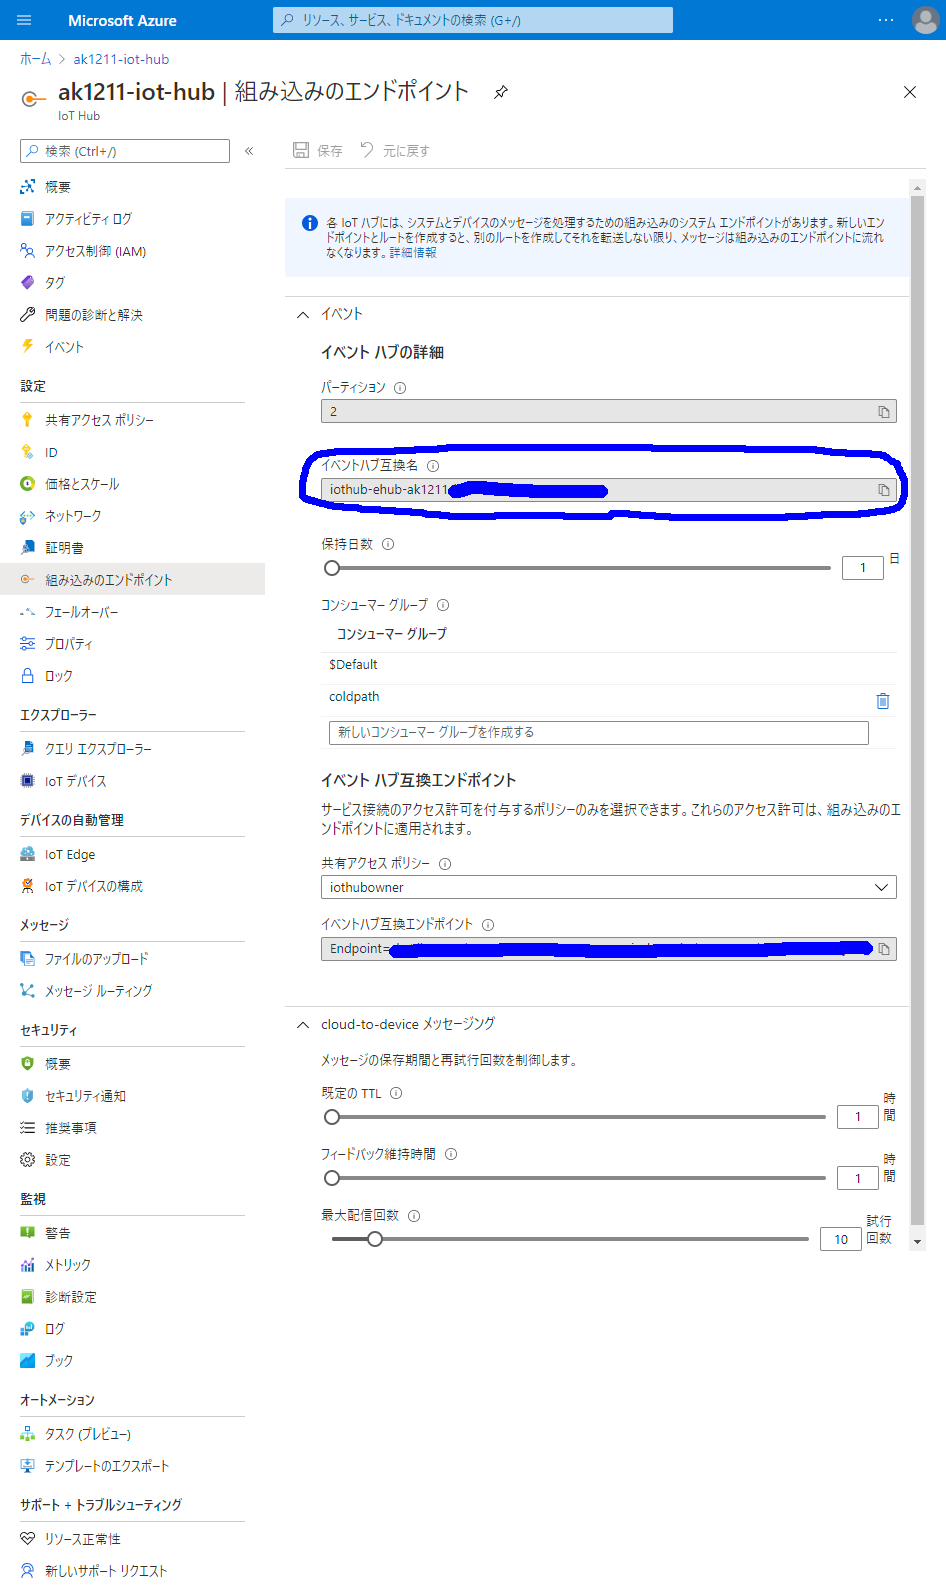
以上の内容で関数アプリを開始する。
テストと実行
2021-01-25T14:55:12  Welcome, you are now connected to log-streaming service. The default timeout is 2 hours. Change the timeout with the App Setting SCM_LOGSTREAM_TIMEOUT (in seconds).
2021-01-25T14:57:36.908 [Error] Microsoft.Azure.WebJobs.Host: Error indexing method 'Functions.IoTHub_EventHub1'. Microsoft.WindowsAzure.Storage: Value cannot be null. (Parameter 'connectionString').
2021-01-25T14:57:36.925 [Error] Microsoft.Azure.WebJobs.Host: Error indexing method 'Functions.IoTHub_EventHub1'. Microsoft.WindowsAzure.Storage: Value cannot be null. (Parameter 'connectionString').接続文字列が無いという意味のエラーが出るので,
エラーメッセージを検索して出てきた Stack Overflowの回答1 を参考にする。
それによると"AzureWebJobsStorage"の設定がないのが原因だということなので
“AzureWebJobsStorage"を追加します。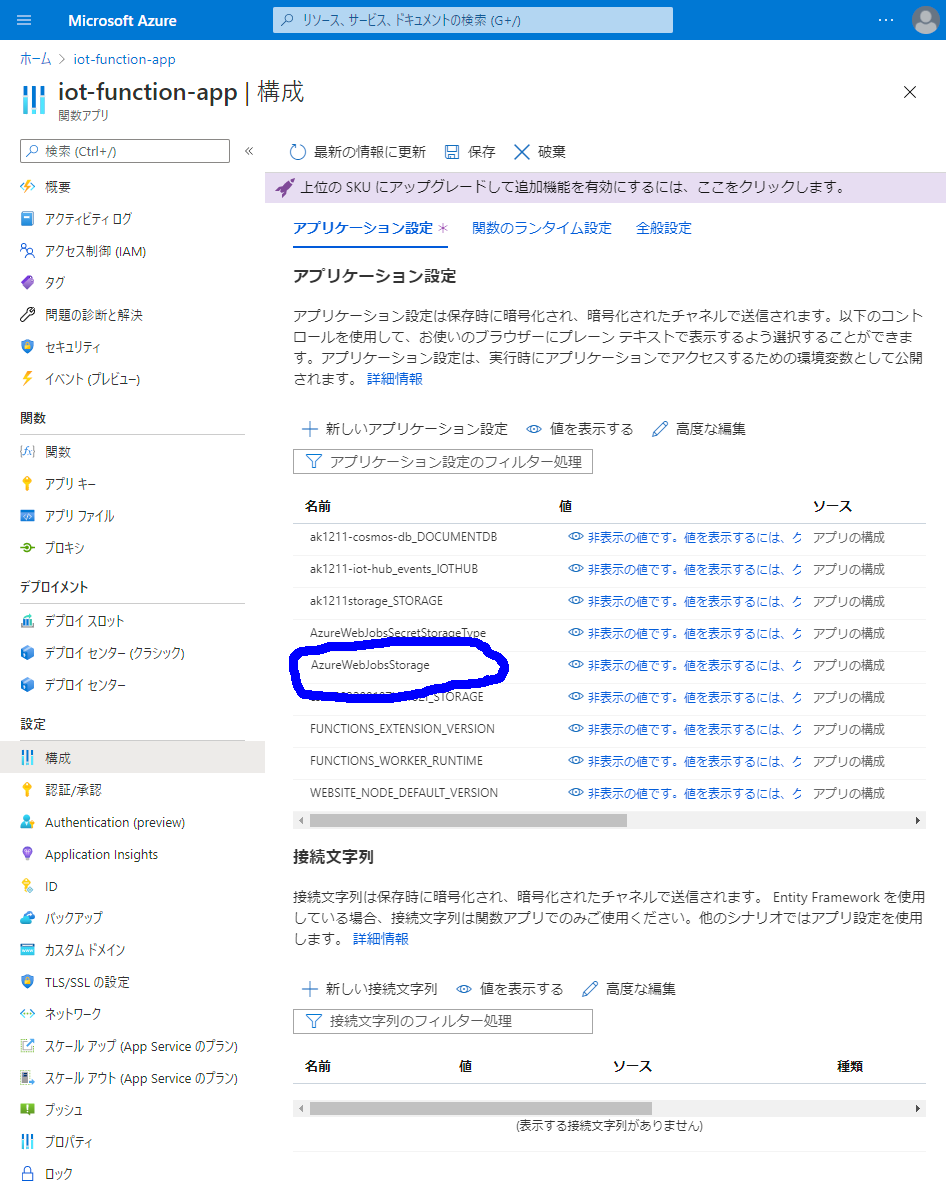
“AzureWebJobsStorage"の内容はこの画面の接続文字列を入れて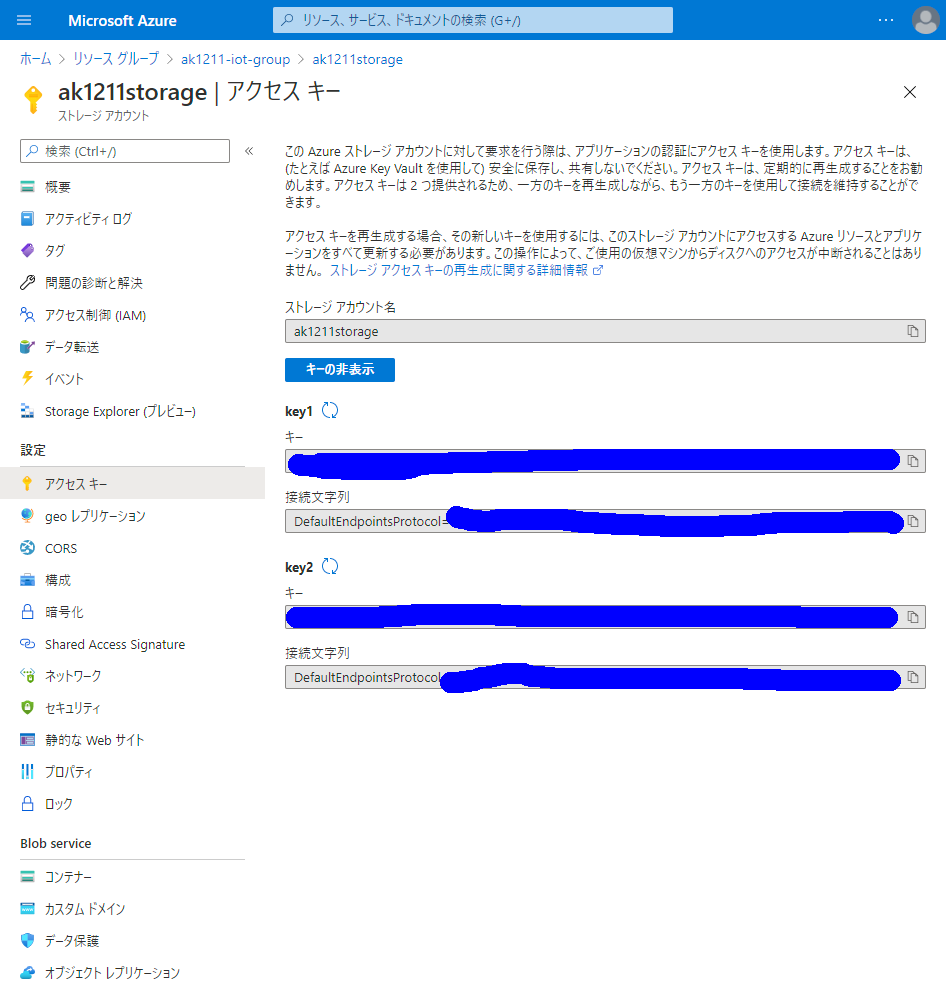
構成を保存する。
ここまでの設定が済むとM5StackからAzure IoT Hubにメッセージが送信されると, ログが出てくる。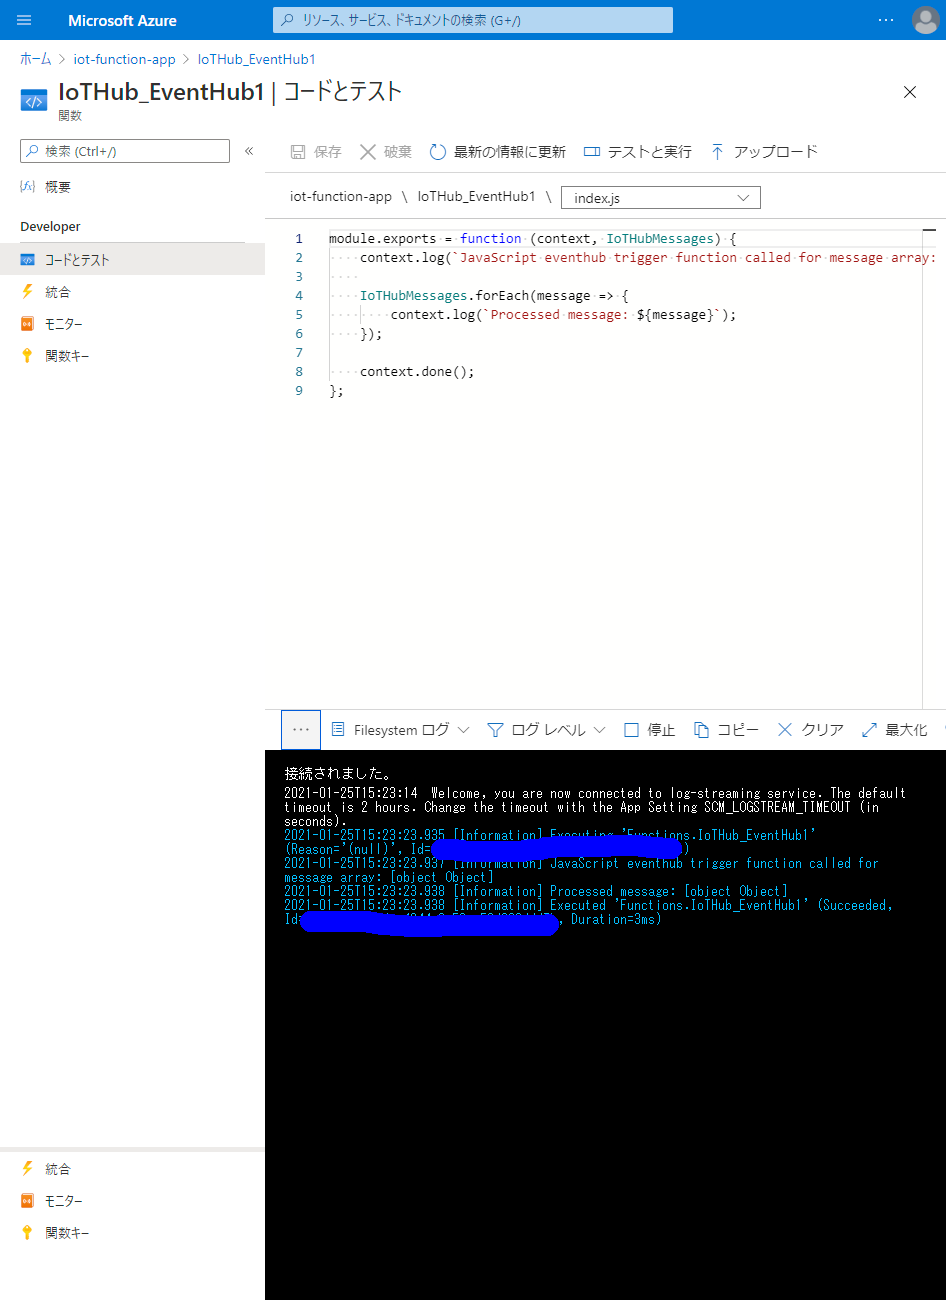
2021-01-25T15:23:14  Welcome, you are now connected to log-streaming service. The default timeout is 2 hours. Change the timeout with the App Setting SCM_LOGSTREAM_TIMEOUT (in seconds).
2021-01-25T15:23:23.935 [Information] Executing 'Functions.IoTHub_EventHub1' (Reason='(null)', Id=xxxxxxxx-xxxx-xxxx-xxxx-xxxxxxxxxxxx)
2021-01-25T15:23:23.937 [Information] JavaScript eventhub trigger function called for message array: [object Object]
2021-01-25T15:23:23.938 [Information] Processed message: [object Object]
2021-01-25T15:23:23.938 [Information] Executed 'Functions.IoTHub_EventHub1' (Succeeded, Id=xxxxxxxx-xxxx-xxxx-xxxx-xxxxxxxxxxxx, Duration=3ms)メッセージの内容を確認する。
ちょっといじる。
module.exports = function (context, IoTHubMessages) {
    context.log(`JavaScript eventhub trigger function called for message array: ${IoTHubMessages}`);

    IoTHubMessages.forEach(message => {
//        context.log(`Processed message: ${message}`);
        context.log(message);
    });

    context.done();
};2021-01-25T15:23:14 Welcome, you are now connected to log-streaming service. The default timeout is 2 hours. Change the timeout with the App Setting SCM_LOGSTREAM_TIMEOUT (in seconds).
2021-01-25T15:23:23.935 [Information] Executing 'Functions.IoTHub_EventHub1' (Reason='(null)', Id=xxxxxxxx-xxxx-xxxx-xxxx-xxxxxxxxxxxx)
2021-01-25T15:23:23.937 [Information] JavaScript eventhub trigger function called for message array: [object Object]
2021-01-25T15:23:23.938 [Information] Processed message: [object Object]
2021-01-25T15:23:23.938 [Information] Executed 'Functions.IoTHub_EventHub1' (Succeeded, Id=xxxxxxxx-xxxx-xxxx-xxxx-xxxxxxxxxxxx, Duration=3ms)
2021-01-25T15:24:24.073 [Information] Executing 'Functions.IoTHub_EventHub1' (Reason='(null)', Id=xxxxxxxx-xxxx-xxxx-xxxx-xxxxxxxxxxxx)
2021-01-25T15:24:24.074 [Information] JavaScript eventhub trigger function called for message array: [object Object]
2021-01-25T15:24:24.074 [Information] Processed message: [object Object]
2021-01-25T15:24:24.075 [Information] Executed 'Functions.IoTHub_EventHub1' (Succeeded, Id=xxxxxxxx-xxxx-xxxx-xxxx-xxxxxxxxxxxx, Duration=2ms)
2021-01-25T15:25:24.207 [Information] Executing 'Functions.IoTHub_EventHub1' (Reason='(null)', Id=xxxxxxxx-xxxx-xxxx-xxxx-xxxxxxxxxxxx)
2021-01-25T15:25:24.210 [Information] JavaScript eventhub trigger function called for message array: [object Object]
2021-01-25T15:25:24.210 [Information] Processed message: [object Object]
2021-01-25T15:25:24.211 [Information] Executed 'Functions.IoTHub_EventHub1' (Succeeded, Id=xxxxxxxx-xxxx-xxxx-xxxx-xxxxxxxxxxxx, Duration=3ms)
2021-01-25T15:26:24.343 [Information] Executing 'Functions.IoTHub_EventHub1' (Reason='(null)', Id=xxxxxxxx-xxxx-xxxx-xxxx-xxxxxxxxxxxx)
2021-01-25T15:26:24.345 [Information] JavaScript eventhub trigger function called for message array: [object Object]
2021-01-25T15:26:24.345 [Information] Processed message: [object Object]
2021-01-25T15:26:24.346 [Information] Executed 'Functions.IoTHub_EventHub1' (Succeeded, Id=xxxxxxxx-xxxx-xxxx-xxxx-xxxxxxxxxxxx, Duration=3ms)
2021-01-25T15:27:19.868 [Information] Executing 'Functions.IoTHub_EventHub1' (Reason='(null)', Id=xxxxxxxx-xxxx-xxxx-xxxx-xxxxxxxxxxxx)
2021-01-25T15:27:19.920 [Information] JavaScript eventhub trigger function called for message array: [object Object]
2021-01-25T15:27:19.920 [Information] {DeviceId: 'm5stack-bme280-device',messageId: 7,temperature: 23.06,humidity: 41.96,pressure: 1023.72}
2021-01-25T15:27:19.922 [Information] Executed 'Functions.IoTHub_EventHub1' (Succeeded, Id=xxxxxxxx-xxxx-xxxx-xxxx-xxxxxxxxxxxx, Duration=63ms)M5Stackから送られている温度, 湿度, 気圧などのメッセージが確認できた。
センサーデータを蓄積するデータベースを準備する。
てきとうにデーターベースとコンテナを用意した, 問題が起きたら起きた時に考えよう。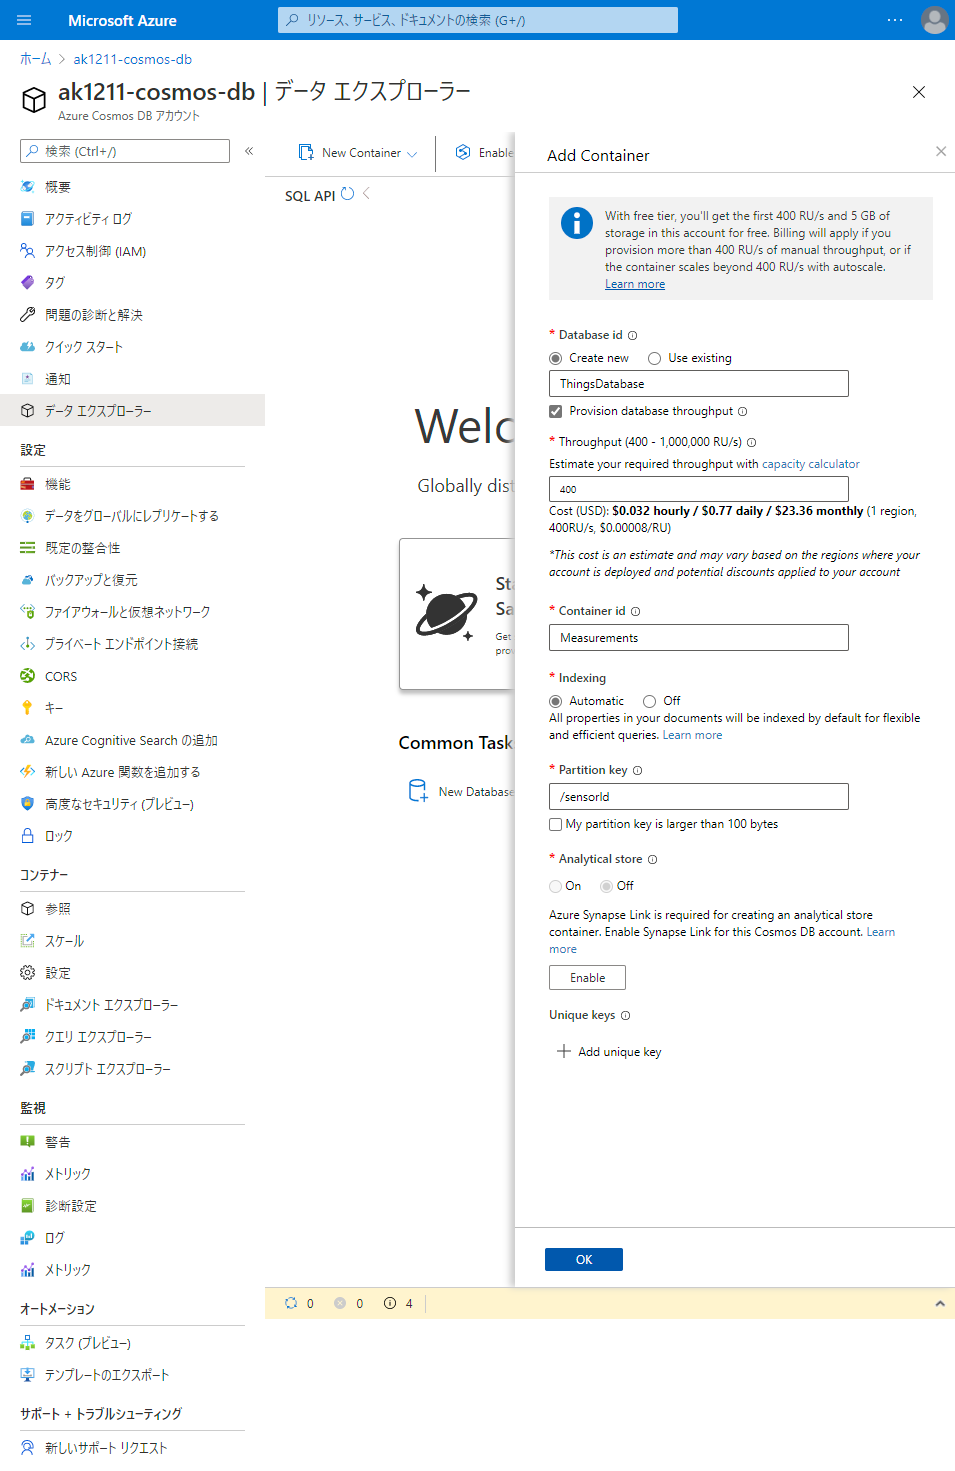
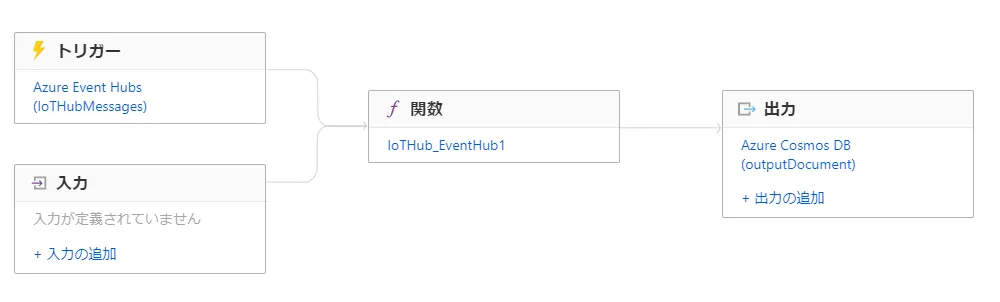
データーベースと関数を統合する。
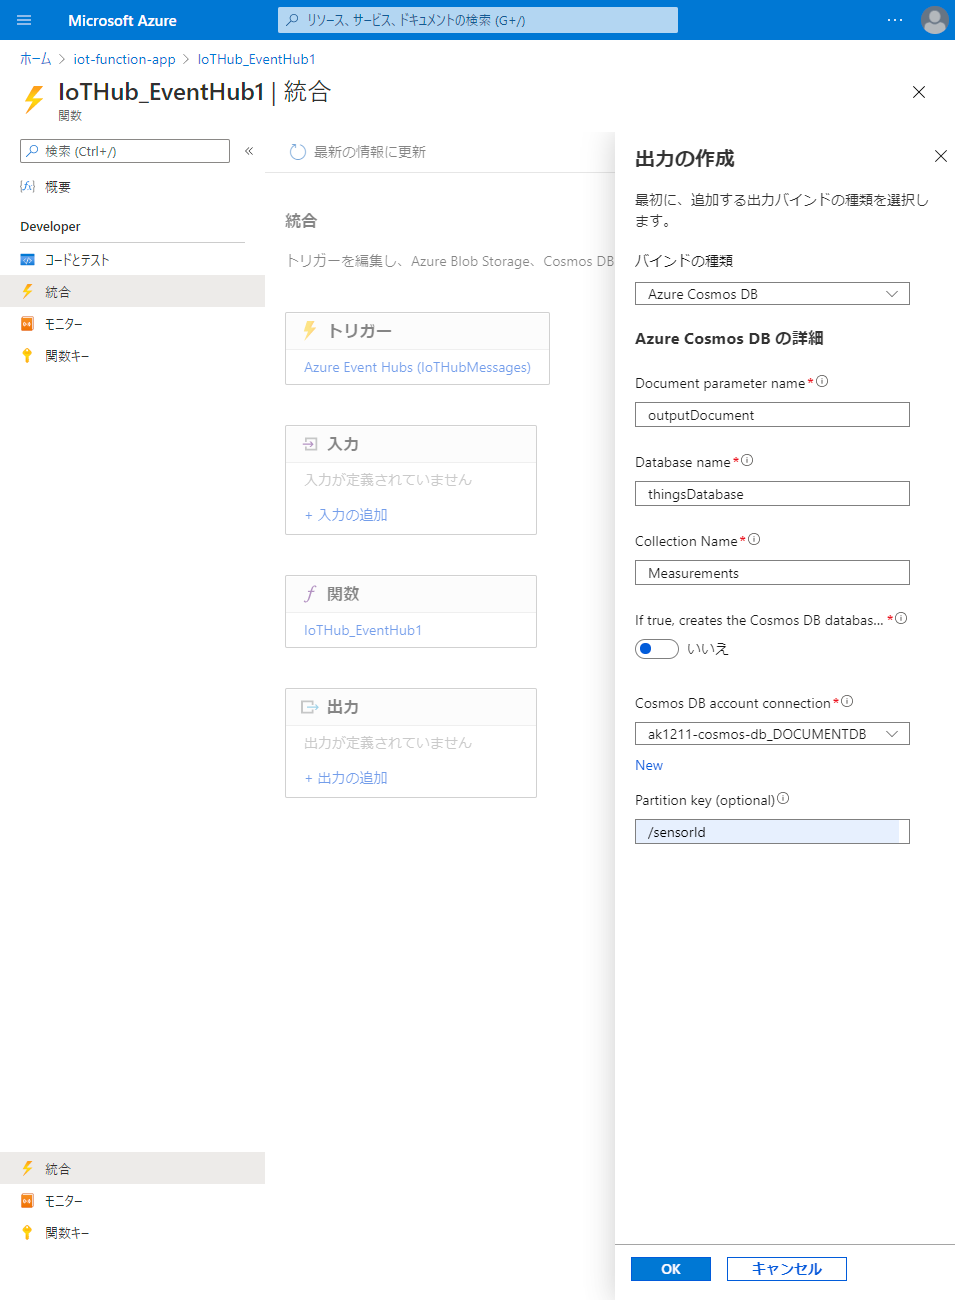
以上の結果で。
トリガー, 関数, 入力, 出力がこういう形になる。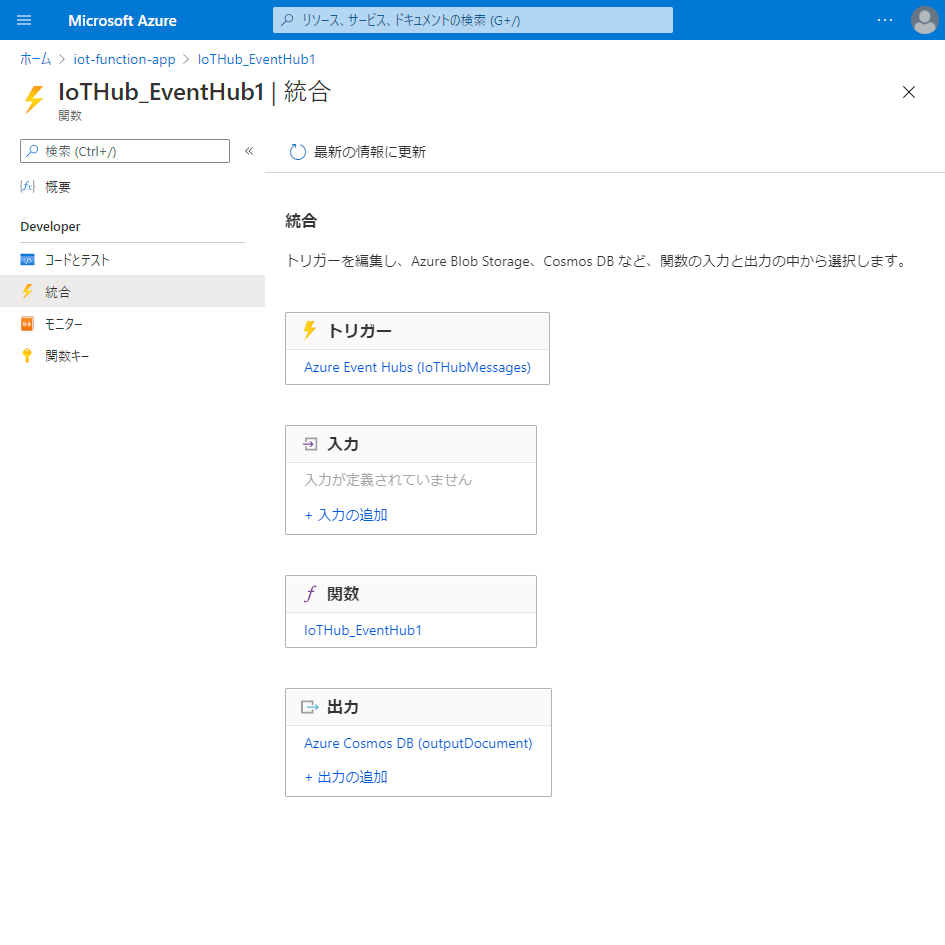
GitHubリポジトリ
このソフトウェアをM5Stack Core2に書き込んで実行しておくと,
Azure IoT HubにBME280センサーの値を送ってくる。
https://github.com/ak1211/m5stack-azure-iot
関数のコードとログ出力
関数のコードを調整してログを確認する。
{
  "bindings": [
    {
      "name": "IoTHubMessages",
      "connection": "xxxxxxxxxxxxxxxxxxxxxxxxxxxx",
      "eventHubName": "xxxxxxxxxxxxxxxxxxxxxxxxxxxxxxxxxxxxxxxxx",
      "consumerGroup": "$Default",
      "cardinality": "many",
      "direction": "in",
      "type": "eventHubTrigger"
    },
    {
      "name": "outputDocument",
      "direction": "out",
      "type": "cosmosDB",
      "databaseName": "ThingsDatabase",
      "collectionName": "Measurements",
      "connectionStringSetting": "ak1211-cosmos-db_DOCUMENTDB",
      "partitionKey": "/sensorId"
    }
  ]
}module.exports = function (context, IoTHubMessages) {
context.log(`JavaScript eventhub trigger function called for message array: ${IoTHubMessages}`);
IoTHubMessages.forEach(message => {
// We need sensorId parameters.
if (message.sensorId) {
message['proceededAt'] = new Date().toISOString();
context.log(message);
// Set the output binding data from the query object.
context.bindings.outputDocument = message;
// Success.
context.res = {
status: 200
};
} else {
context.res = {
status: 400,
body: "The query options 'sensorId' are required."
};
}
});
context.done();
};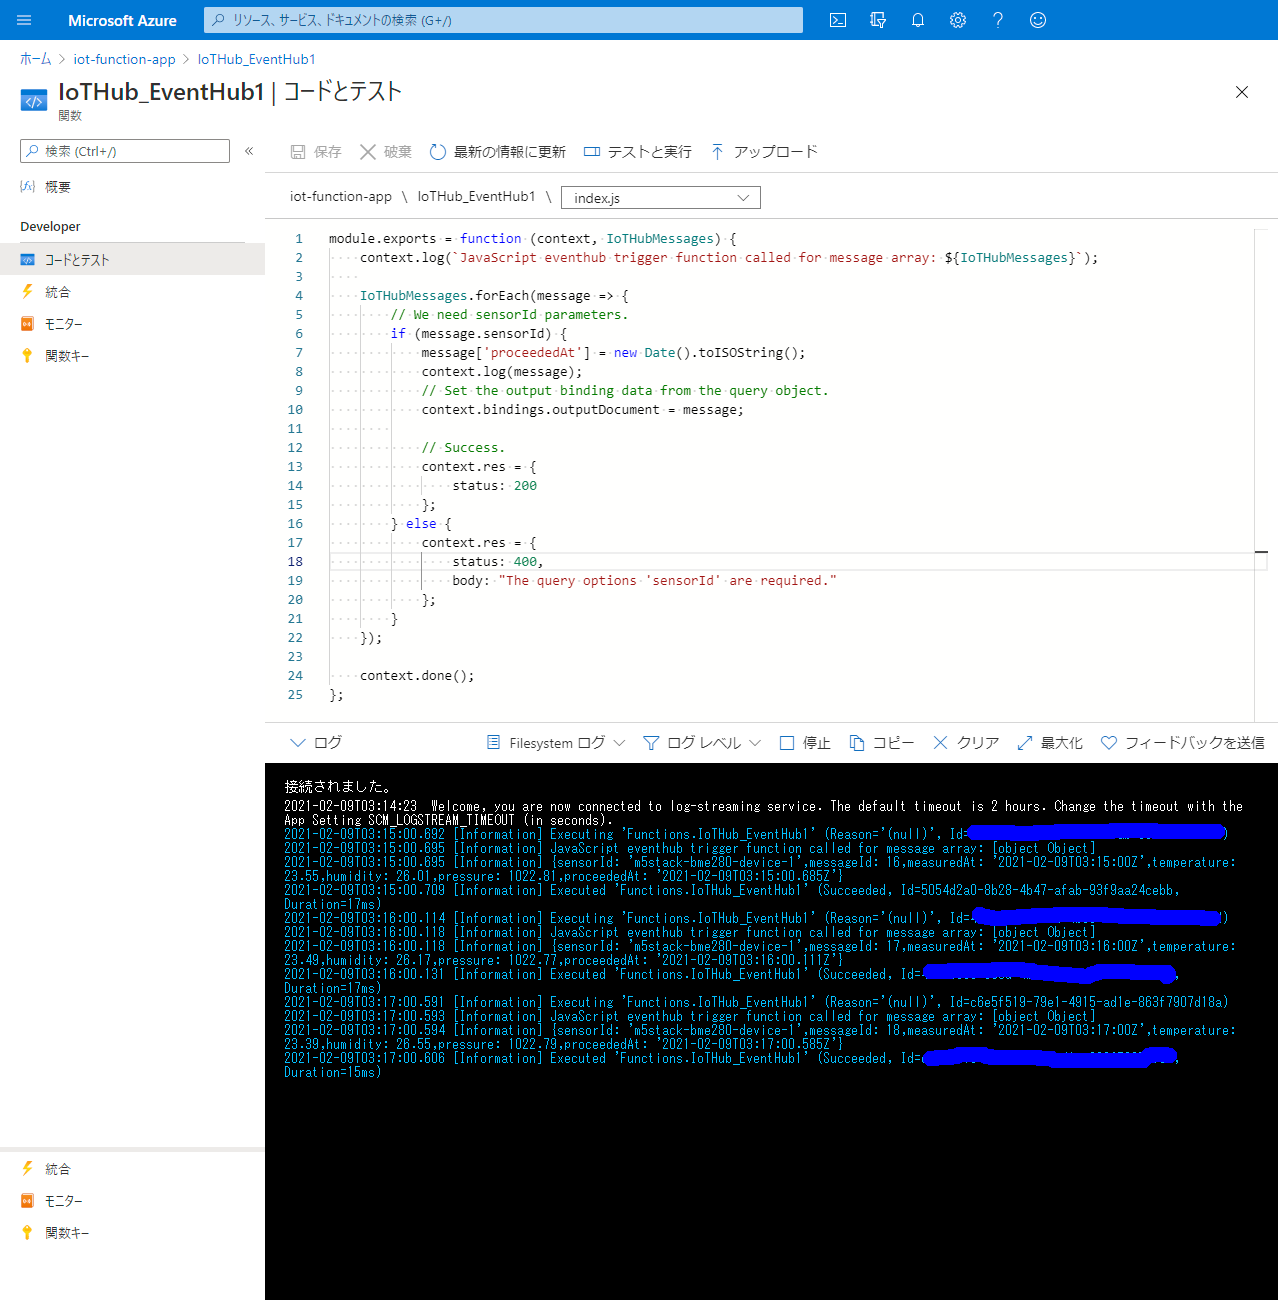
正常なログを確認できた。
追記: この部分バッチ処理に失敗しているようなので
M5Stackに手持ちのセンサー全種を接続してAzure IoT Hubに測定値を送信してみた。の記事で修正した。
データベースに格納されたデータを確認する。
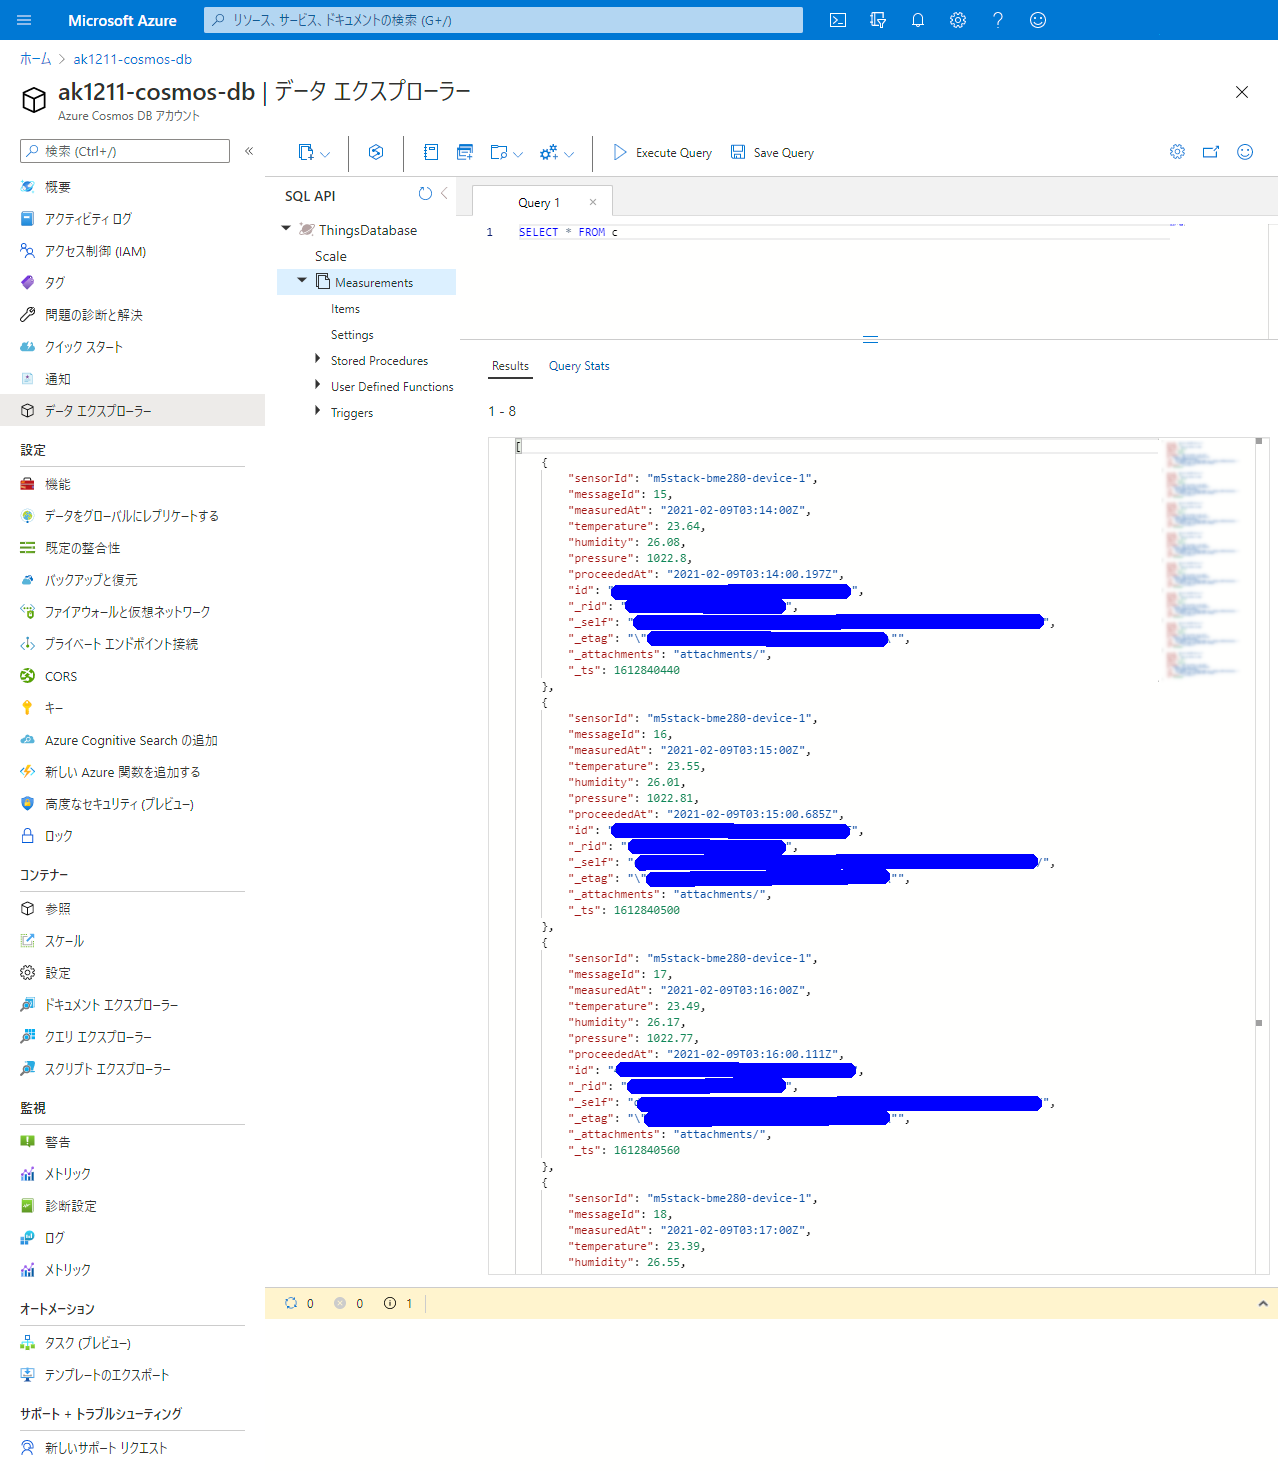
Azure IoT HubからAzure Functionsを経由してAzure Cosmos DBに温度, 湿度, 気圧の値が格納されている。
Azure Cosmos DBでデータの蓄積が出来たので, いずれグラフにでもしてみる。
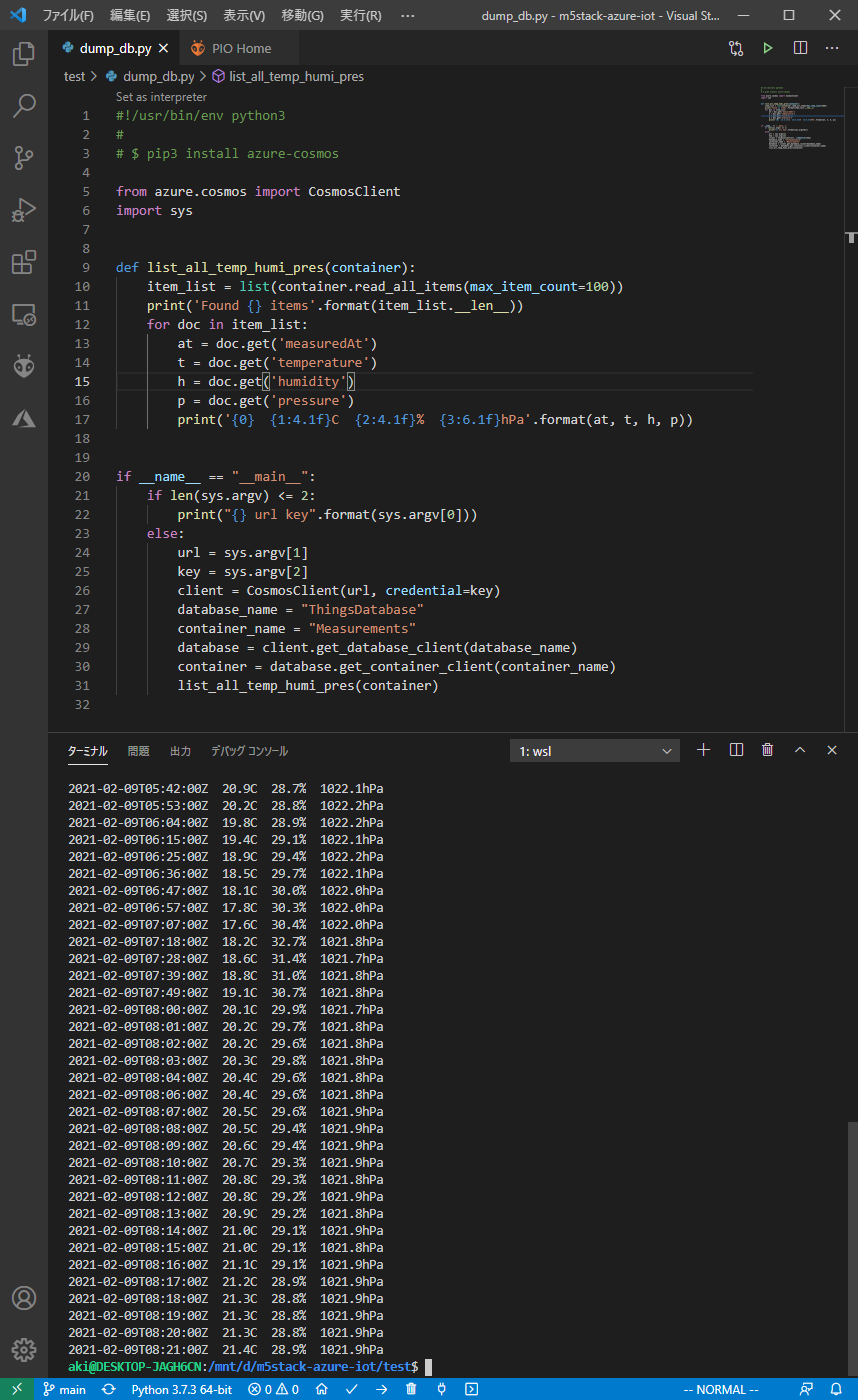
データベースに格納されたデータをグラフにする
Pythonライブラリ( https://pypi.org/project/azure-cosmos/ )を使ってAzure Cosmos DBからデータを取り出してグラフにしてみた。
参考: Azure Cosmos DB の Python サンプル
#!/usr/bin/env python3
#
# $ pip3 install azure-cosmos

from azure.cosmos import CosmosClient
import sys
import numpy as np
import pandas as pd
import matplotlib.pyplot as plt
from matplotlib.dates import DayLocator, HourLocator, DateFormatter
from pytz import timezone
from datetime import datetime
from dateutil import parser


def take_all_items_from_container(container):
    item_list = list(container.read_all_items())
    print('Found {} items'.format(item_list.__len__()))

    pairs = [('measuredAt', parser.parse),
             ('temperature', float),
             ('humidity', float),
             ('pressure', float)]
    columns, conversions = zip(*pairs)

    def pickup(item):
        return [conv(item.get(col)) for (col, conv) in pairs]
    #
    data = [pickup(item) for item in item_list]
    return pd.DataFrame(data=data, columns=columns)


def plot(container):
    df = take_all_items_from_container(container)
    print(df)
    #
    tz = timezone('Asia/Tokyo')
    major_formatter = DateFormatter('\n%Y-%m-%d\n%H:%M:%S\n%Z', tz=tz)
    minor_formatter = DateFormatter('%H', tz=tz)
    #
    fig, axs = plt.subplots(2, 2, figsize=(48.0, 48.0))
    #
    axs[0, 0].xaxis.set_major_locator(HourLocator(interval=12))
    axs[0, 0].xaxis.set_major_formatter(major_formatter)
    axs[0, 0].xaxis.set_minor_locator(HourLocator(interval=1))
    axs[0, 0].xaxis.set_minor_formatter(minor_formatter)
    axs[0, 0].set_ylabel('$^{\circ}C$')
    axs[0, 0].set_title('temperature', fontsize=28)
    axs[0, 0].plot(df['measuredAt'], df['temperature'],
                   label='temperature[$^{\circ}C$]')
    axs[0, 0].grid()
    axs[0, 0].legend(fontsize=18)
    #
    axs[0, 1].xaxis.set_major_locator(HourLocator(interval=12))
    axs[0, 1].xaxis.set_major_formatter(major_formatter)
    axs[0, 1].xaxis.set_minor_locator(HourLocator(interval=1))
    axs[0, 1].xaxis.set_minor_formatter(minor_formatter)
    axs[0, 1].set_ylabel('%')
    axs[0, 1].set_title('relative humidity', fontsize=28)
    axs[0, 1].plot(df['measuredAt'], df['humidity'],
                   label='relative humidity[%]')
    axs[0, 1].grid()
    axs[0, 1].legend(fontsize=18)
    #
    axs[1, 0].xaxis.set_major_locator(HourLocator(interval=12))
    axs[1, 0].xaxis.set_major_formatter(major_formatter)
    axs[1, 0].xaxis.set_minor_locator(HourLocator(interval=1))
    axs[1, 0].xaxis.set_minor_formatter(minor_formatter)
    axs[1, 0].set_ylabel('hPa')
    axs[1, 0].set_title('pressure', fontsize=28)
    axs[1, 0].plot(df['measuredAt'], df['pressure'], label='pressure[hPa]')
    axs[1, 0].grid()
    axs[1, 0].legend(fontsize=18)
    #
#    fig.tight_layout()
    fig.savefig("plot.png")


def run(url, key):
    cosmos_client = CosmosClient(url, credential=key)
    database_name = "ThingsDatabase"
    container_name = "Measurements"
    database = cosmos_client.get_database_client(database_name)
    container = database.get_container_client(container_name)
    plot(container)


if __name__ == "__main__":
    if len(sys.argv) <= 2:
        print("{} url key".format(sys.argv[0]))
    else:
        url = sys.argv[1]
        key = sys.argv[2]
run(url, key)実行した結果
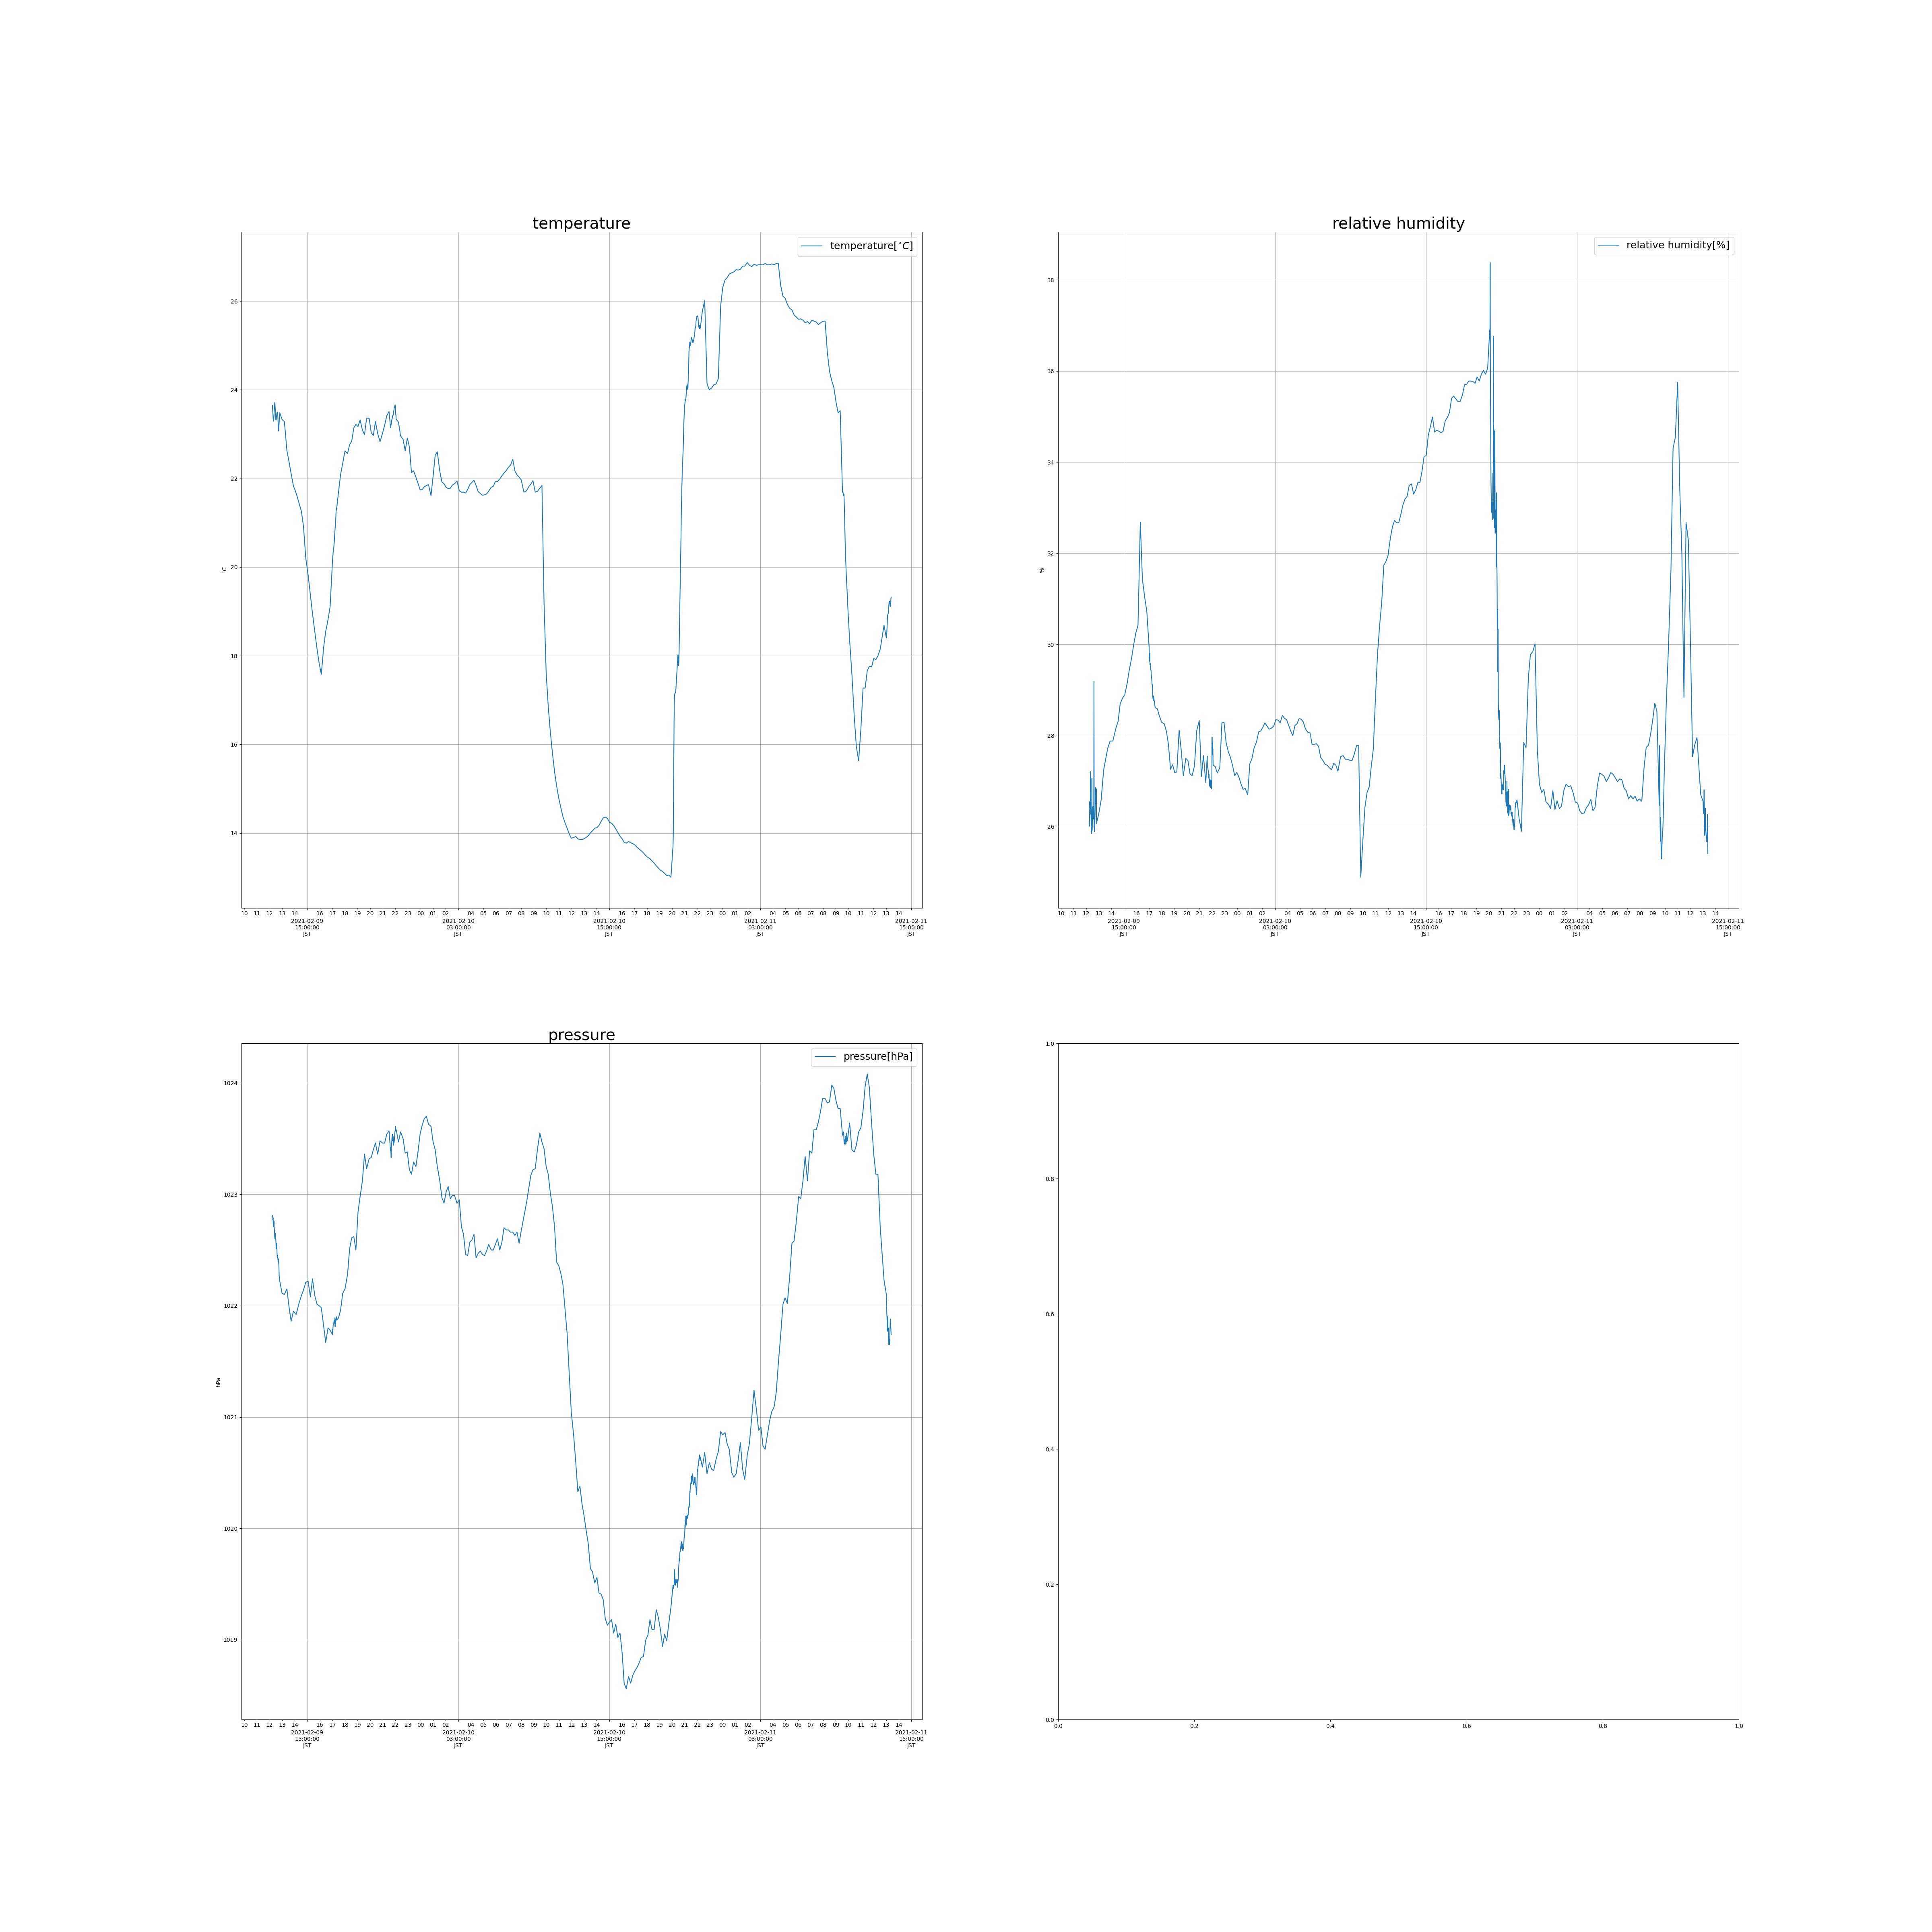
エアコンを止めていた時間に温度が下がっているのがわかる。
外は寒いからね。
コメント