システムトレードプログラムの作り方の参考になるだろうと、Rubyではじめる本を買って読んだ。全体の半分ほどはスクレイピングでした。
自分もここで進捗50%まできたと思う。
まあ、システムトレードプログラムはExcelで充分なんだけどね、linuxサーバ上で動かせない問題があるけれど。
少し進めてGITHUBにあげておきました。
データーベース(MariaDB)投入
ローカルのCSVファイルで大量の情報を扱うのはつらいからね、データーベースが必要だろうと。
この時はDatabase.MySQLを使ったけれども、今回はDatabase.Persistを使います。(マイグレーション機能が便利なんで)
データーベースのモデルを決定
前に作った変なテーブルはすべて削除して、このように定義した。
Model.hs
 1
 2
 3
 4
 5
 6
 7
 8
 9
10
11
12
13
14
15
16
17
18
19
20
21
22
23
24
25
26
27
28
29
| DB.share [DB.mkPersist DB.sqlSettings, DB.mkMigrate "migrateQuotes"] [DB.persistLowerCase|
-- | 株式銘柄テーブル
Portfolio
ticker TickerSymbol -- ^ ティッカー
caption Text Maybe -- ^ 銘柄名
updateAt UTCTime Maybe -- ^ 価格情報を取り込んだ日付時間
deriving Show
-- | 初値, 高値, 安値, 終値, 出来高, 売買代金テーブル
Ohlcvt
ticker TickerSymbol -- ^ ティッカー
tf TimeFrame -- ^ 時間枠
at UTCTime -- ^ 日付時間
open Double Maybe -- ^ 初値
high Double Maybe -- ^ 高値
low Double Maybe -- ^ 安値
close Double Maybe -- ^ 終値
volume Double Maybe -- ^ 出来高
turnover Double Maybe -- ^ 売買代金
source Text Maybe -- ^ 情報の入手元
deriving Show
-- | テクニカル指標テーブル
TechInds
ohlcvt OhlcvtId -- ^ 紐付け
ind TechnicalInds -- ^ テクニカル指標
val Double -- ^ 値
deriving Show
|]
|
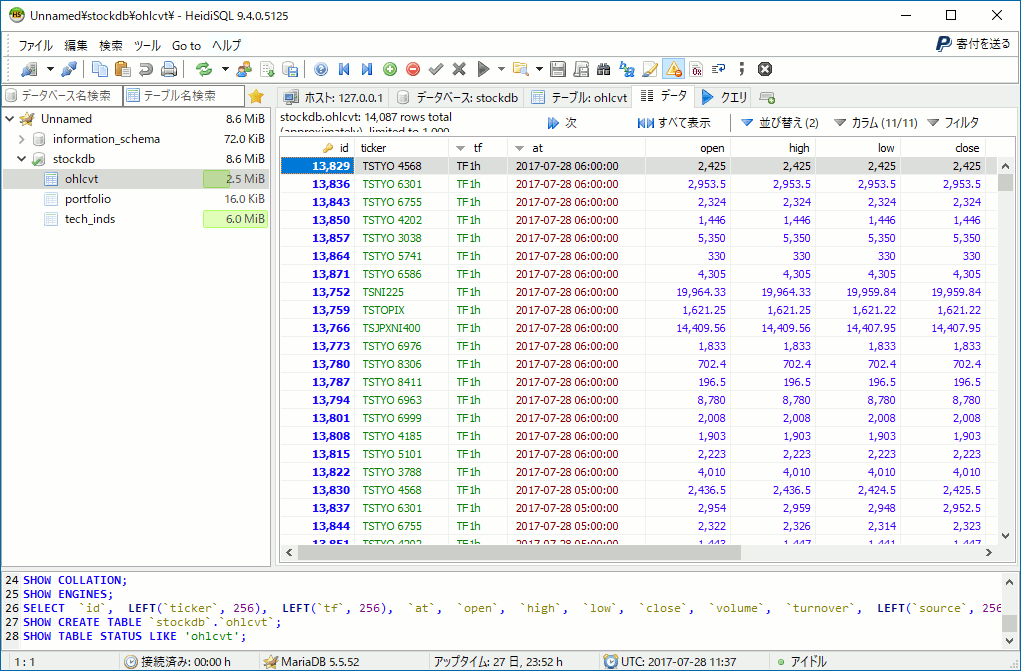
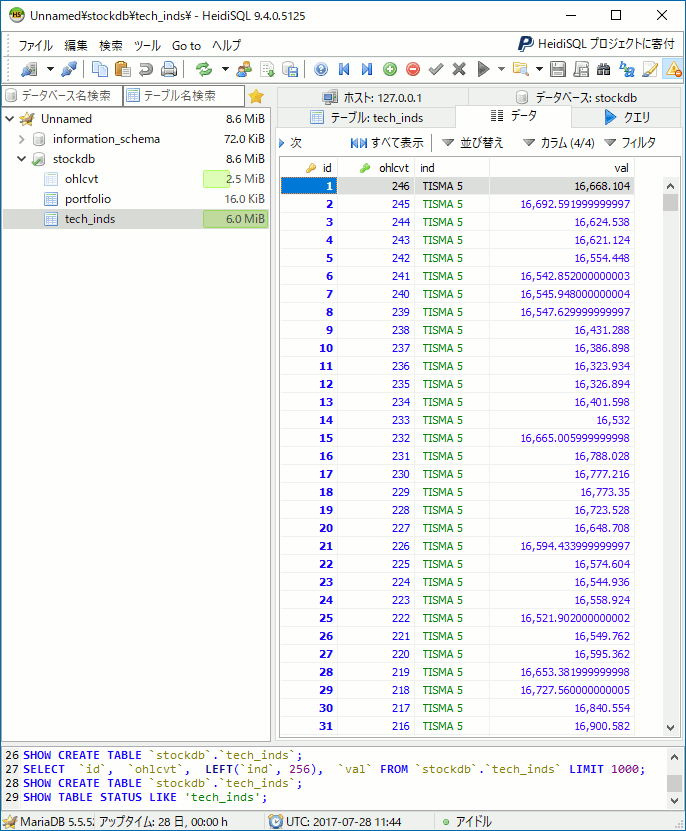
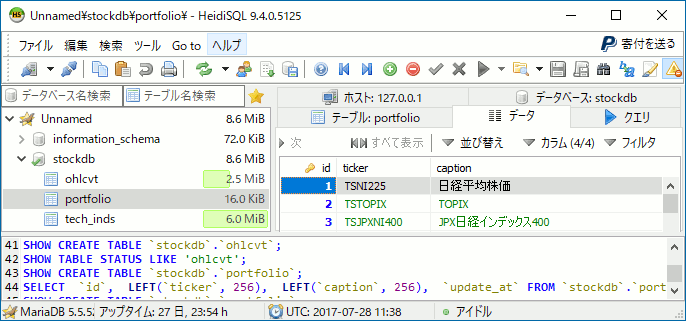
こうしておくと勝手にportfolio, ohlcvt, tech_indsの3テーブルが作られる。
それぞれティッカーはここで。
時間枠はここで。
テクニカル指標はここで定義した。
見てのとおりデータベースにある時間はUTC時間です、日本時間ではありません。
集計処理
コードの正確性の確認はしていませんので、あしからずご了承くださいませ。
収集処理で取ってきているのは1時間足(初回なら日足もついでに)なので、それを集計して日足を作り出す処理を作りました。
aggregateOfOHLCVT - Aggregate.hs
 1
 2
 3
 4
 5
 6
 7
 8
 9
10
11
12
13
14
15
16
17
18
19
20
21
22
23
24
25
26
27
28
29
30
31
32
33
34
35
36
37
38
| -- | 始値, 高値, 安値, 終値, 出来高, 売買代金を集計する関数
aggregateOfOHLCVT :: (Ohlcvt -> Maybe Ohlcvt) -- ^ 値の判定関数
-> [Ohlcvt] -- ^ 時系列通りで与えること
-> Maybe Ohlcvt
aggregateOfOHLCVT _ [] = Nothing -- 空リストの結果は未定義
aggregateOfOHLCVT decide serials@(first:_) =
decide -- 集計結果が有効か無効かの判定をゆだねる。
Ohlcvt
{ ohlcvtTicker = ohlcvtTicker first
, ohlcvtTf = ohlcvtTf first
, ohlcvtAt = ohlcvtAt first
-- 6本値は欠損値を許容する
, ohlcvtOpen = open $ Mb.mapMaybe ohlcvtOpen serials
, ohlcvtHigh = high $ Mb.mapMaybe ohlcvtHigh serials
, ohlcvtLow = low $ Mb.mapMaybe ohlcvtLow serials
, ohlcvtClose = close $ Mb.mapMaybe ohlcvtClose serials
, ohlcvtVolume = vtSum $ Mb.mapMaybe ohlcvtVolume serials
, ohlcvtTurnover = vtSum $ Mb.mapMaybe ohlcvtTurnover serials
--
, ohlcvtSource = T.append "agg from " <$> ohlcvtSource first
}
where
-- | 集計期間中の初値
open :: [Double] -> Maybe Double
open = Safe.headMay
-- | 集計期間中の最高値
high :: [Double] -> Maybe Double
high = Safe.maximumMay
-- | 集計期間中の最安値
low :: [Double] -> Maybe Double
low = Safe.minimumMay
-- | 集計期間中の終値
close :: [Double] -> Maybe Double
close = Safe.headMay . reverse
-- | 集計期間中の総和
vtSum :: [Double] -> Maybe Double
vtSum [] = Nothing
vtSum xs = Just $ sum xs
|
- 初値(open)の定義
リストの先頭 - 高値(high)の定義
全要素の最高値 - 安値(low)の定義
全要素の最安値 - 終値(close)の定義
リストの最終 - 出来高(volume)及び売買代金(turnover)の定義
全要素の和
そのままの定義を書いています。
テクニカル指標を作る
コードの正確性の確認はしていませんので、あしからずご了承くださいませ。
portfolioテーブルにある銘柄を対象にテクニカル指標を計算する処理を作りました。
runAggregateOfPortfolios - Aggregate.hs
 1
 2
 3
 4
 5
 6
 7
 8
 9
10
11
12
13
14
15
16
17
18
19
20
21
22
23
24
25
26
27
28
29
30
31
32
33
34
35
36
37
38
39
40
41
42
43
44
45
46
47
48
49
50
51
52
53
54
55
56
57
58
59
60
61
| -- | Portfolio上の情報を集計する関数
runAggregateOfPortfolios :: M.MonadIO m => Conf.Info -> C.Source m TL.Text
runAggregateOfPortfolios conf = do
-- 処理対象銘柄の数
counts <- M.liftIO . runStderrLoggingT . MR.runResourceT . MySQL.withMySQLConn connInfo . MySQL.runSqlConn $ do
DB.runMigration migrateQuotes
DB.count ([] :: [DB.Filter Portfolio])
C.yield . TB.toLazyText $
case counts of
0 -> "集計処理の対象銘柄がありません。"
x -> "集計処理の対象銘柄は全部で" <> TB.decimal x <> "個有ります。"
-- 処理対象銘柄のリストを得る
ps <- M.liftIO . runStderrLoggingT . MR.runResourceT . MySQL.withMySQLConn connInfo . MySQL.runSqlConn $ do
DB.runMigration migrateQuotes
map DB.entityVal <$> DB.selectList [] [DB.Asc PortfolioId]
-- 銘柄毎に集計処理
M.forM_ (zip ps [1..]) $ \(val, number) -> do
let ticker = portfolioTicker val
let textCaption = Mb.fromMaybe (T.pack . show $ portfolioTicker val) $ portfolioCaption val
let progress= TB.singleton '[' <> TB.decimal (number :: Int)
<> TB.singleton '/' <> TB.decimal counts
<> TB.singleton ']'
C.yield . TB.toLazyText $ TB.fromText textCaption <> " を集計中。" <> progress
M.liftIO $ do
aggregate connInfo ticker
--
let calc = calculate connInfo ticker
--
calc TF1d (TISMA 5)
calc TF1d (TISMA 10)
calc TF1d (TISMA 25)
calc TF1d (TISMA 75)
--
calc TF1d (TIEMA 5)
calc TF1d (TIEMA 10)
calc TF1d (TIEMA 25)
calc TF1d (TIEMA 75)
--
calc TF1d (TIRSI 9)
calc TF1d (TIRSI 14)
--
calc TF1d (TIMACD 12 26)
calc TF1d (TIMACDSIG 12 26 9)
--
calc TF1d (TIPSYCHOLO 12)
C.yield "集計処理を終了します。"
where
--
connInfo :: MySQL.ConnectInfo
connInfo =
let mdb = Conf.mariaDB conf in
MySQL.defaultConnectInfo
{ MySQL.connectHost = Conf.host mdb
, MySQL.connectPort = Conf.port mdb
, MySQL.connectUser = Conf.user mdb
, MySQL.connectPassword = Conf.password mdb
, MySQL.connectDatabase = Conf.database mdb
}
|
上の関数から呼ばれる、この関数がテクニカル指標を作る関数を呼び出す。(今回は全て終値を使って計算する)
runAggregateOfPortfolios - Aggregate.hs
 1
 2
 3
 4
 5
 6
 7
 8
 9
10
11
12
13
14
15
16
17
18
19
20
21
22
23
| -- | 指定の指標を計算する
calcIndicator :: TechnicalInds -> [DB.Entity Ohlcvt] -> [(DB.Entity Ohlcvt, TechInds)]
calcIndicator indicator entities =
case indicator of
TISMA period -> ohlcvtClose `apply` (TI.sma period)
TIEMA period -> ohlcvtClose `apply` (TI.ema period)
TIRSI period -> ohlcvtClose `apply` (TI.rsi period)
TIMACD fastP slowP -> ohlcvtClose `apply` (TI.macd fastP slowP)
TIMACDSIG fastP slowP sigP -> ohlcvtClose `apply` (TI.macdSignal fastP slowP sigP)
TIPSYCHOLO period -> ohlcvtClose `apply` (TI.psycologicalLine period)
where
apply :: (Ohlcvt -> Maybe Double) -> ([Double] -> [Maybe Double]) -> [(DB.Entity Ohlcvt, TechInds)]
apply price formula =
let entAndPrices = [(e,pr) | e<-entities, let (Just pr)=price $ DB.entityVal e] in
let (es,ps) = unzip entAndPrices in
let entAndValues = zip es $ formula ps in
[(e, makeTI e v) | (e, Just v)<-entAndValues]
--
makeTI e v = TechInds
{ techIndsOhlcvt = DB.entityKey e
, techIndsInd = indicator
, techIndsVal = v
}
|
単純移動平均(SMA)
テクニカル分析ABC > 第3回 移動平均をよく読んでSMA関数を作る。
sma - TechnicalIndicators.hs
 1
 2
 3
 4
 5
 6
 7
 8
 9
10
11
12
13
14
15
16
17
18
19
20
21
22
23
24
25
26
27
28
29
30
31
32
33
| -- | 単純移動平均(SMA)
-- リストの先頭から計算する版
sma :: Int -> [Double] -> [Maybe Double]
sma period prices
| period < 1 = error "期間は1以上でね"
| length prices < period = replicate (length prices) Nothing
| otherwise =
let (seeds, ps) = splitAt period prices in
let na = replicate (period-1) Nothing in
let val = snd $ sma' period (reverse seeds) ps in
na ++ map Just val
type SmaAccumlator = [Double]
-- | 単純移動平均(SMA)
-- 初期のアキュムレータを入力と別々に渡して計算する版
sma' :: Int
-> SmaAccumlator -- ^| 最新の値が先頭の並びで渡す事
-> [Double] -- ^| 入力は時系列通りで渡す事
-> (SmaAccumlator, [Double]) -- ^| 計算を打ち切った時のアキュムレータの値と結果のタプル
sma' period seeds prices
| period < 1 = error "期間は1以上でね"
| length seeds /= period = error "アキュムレータの数と周期が一致していないよ"
| otherwise =
let (acc, xs) = List.mapAccumL go seeds prices in
let lst = snd $ go acc 0.0 in -- 最後にアキュムレータに残った値を押し出す
( acc
, xs ++ [lst]
)
where
go :: SmaAccumlator -> Double -> (SmaAccumlator, Double)
go acc price = ( price : init acc
, sum acc / realToFrac period
)
|
mapAccum関数によってアキュムレータを持ち回りながら
sum acc / realToFrac period
これを計算するということ。
サイコロジカル・ライン
テクニカル分析ABC > 第7回 サイコロジカル・ラインをよく読んでサイコロジカル・ライン関数を作る。
psycologicalLine - TechnicalIndicators.hs
 1
 2
 3
 4
 5
 6
 7
 8
 9
10
11
12
13
14
15
16
17
18
19
20
21
22
23
24
25
26
27
28
29
30
31
32
33
34
35
36
37
38
39
40
41
42
43
44
45
46
47
48
| -- | サイコロジカルライン
-- リストの先頭から計算する版
psycologicalLine :: Int -> [Double] -> [Maybe Double]
psycologicalLine period prices
| period < 1 = error "期間は1以上でね"
| length prices <= period = replicate (length prices) Nothing
| otherwise =
let (seeds, ps) = splitAt (period+1) prices in
let diffs = zipWith (-) (drop 1 seeds) seeds in
let seed = PsycoloAccumlator
{ psycoloDiffs = reverse diffs
, psycoloLastPrice = Safe.lastNote "たぶんこの例外は発生しないかな" seeds
}
in
let val = snd $ psycologicalLine' period seed ps in
let na = replicate period Nothing in
na ++ map Just val
data PsycoloAccumlator = PsycoloAccumlator
{ psycoloDiffs :: [Double]
, psycoloLastPrice :: Double
} deriving (Show, Eq, Ord)
-- | サイコロジカルライン
-- 初期のアキュムレータを入力と別々に渡して計算する版
psycologicalLine' :: Int
-> PsycoloAccumlator -- ^| 最新の値が先頭の並びで渡す事
-> [Double] -- ^| 入力は時系列通りで渡す事
-> (PsycoloAccumlator, [Double]) -- ^| 計算を打ち切った時のアキュムレータの値と結果のタプル
psycologicalLine' period seed prices
| period < 1 = error "期間は1以上でね"
| otherwise =
let (acc, xs) = List.mapAccumL go seed prices in
let lst = snd $ go acc 0.0 in -- 最後にアキュムレータに残った値を押し出す
( acc
, xs ++ [lst]
)
where
--
go :: PsycoloAccumlator -> Double -> (PsycoloAccumlator, Double)
go (PsycoloAccumlator diffs lastPrice) price =
let t = PsycoloAccumlator
{ psycoloDiffs = (price - lastPrice) : init diffs
, psycoloLastPrice = price
}
in
( t
, sum [1 | x<-diffs, x>=0] / realToFrac period * 100.0
)
|
サイコロジカル・ライン= 12日間の内上昇した日 ÷ 12 × 100(%)
テクニカル分析ABC > 第7回 サイコロジカル・ライン
mapAccum関数によってアキュムレータを持ち回りながら
sum [1 | x<-diffs, x>=0] / realToFrac period * 100.0
これを計算するということ。
[1 | x<-diffs, x>=0] これは上がった日は1、下がった日はリストから除かれる(つまり後のsum計算に入らない)という意味。
RSI(Relative Strength Index)
テクニカル分析ABC > 第8回 RSI(Relative Strength Index)をよく読んでRSI関数を作る。
rsi - TechnicalIndicators.hs
 1
 2
 3
 4
 5
 6
 7
 8
 9
10
11
12
13
14
15
16
17
18
19
20
21
22
23
24
25
26
27
28
29
30
31
32
33
34
35
36
37
38
39
40
41
42
43
44
45
46
47
48
49
50
51
52
53
54
55
56
57
58
59
| -- | 相対力指数(RSI)
-- リストの先頭から計算する版
rsi :: Int -> [Double] -> [Maybe Double]
rsi period prices
| period < 1 = error "期間は1以上でね"
| length prices <= period = replicate (length prices) Nothing
| otherwise =
let (seeds, ps) = splitAt (period+1) prices in
let diffs = zipWith (-) (drop 1 seeds) seeds in
let seed = RsiAccumlator
{ rsiAscend = sum [abs v | v<-diffs, v >= 0] / realToFrac period
, rsiDescend = sum [abs v | v<-diffs, v < 0] / realToFrac period
, rsiLastPrice = Safe.lastNote "たぶんこの例外は発生しないかな" seeds
}
in
let val = snd $ rsi' period seed ps in
let na = replicate period Nothing in
na ++ map Just val
data RsiAccumlator = RsiAccumlator
{ rsiAscend :: Double
, rsiDescend :: Double
, rsiLastPrice :: Double
} deriving (Show, Eq, Ord)
-- | 相対力指数(RSI)
-- 初期のアキュムレータを入力と別々に渡して計算する版
rsi' :: Int
-> RsiAccumlator
-> [Double]
-> (RsiAccumlator, [Double]) -- ^| 計算を打ち切った時のアキュムレータの値と結果のタプル
rsi' period seed prices
| period < 1 = error "期間は1以上でね"
| otherwise =
let (acc, xs) = List.mapAccumL go seed prices in
let lst = snd $ go acc 0.0 in -- 最後にアキュムレータに残った値を押し出す
( acc
, xs ++ [lst]
)
where
--
go :: RsiAccumlator -> Double -> (RsiAccumlator, Double)
go acc price =
let a = rsiAscend acc * realToFrac (period - 1) in
let d = rsiDescend acc * realToFrac (period - 1) in
let t = case price - rsiLastPrice acc of
x | x >= 0 -> RsiAccumlator
{ rsiAscend = (a + abs x) / realToFrac period
, rsiDescend = d / realToFrac period
, rsiLastPrice = price
}
| otherwise -> RsiAccumlator
{ rsiAscend = a / realToFrac period
, rsiDescend = (d + abs x) / realToFrac period
, rsiLastPrice = price
}
in
( t
, rsiAscend acc / (rsiAscend acc + rsiDescend acc) * 100.0
)
|
最初に14日間RSIを求める式(公式1)
$$
\frac{A}{A+B} \times 100 \\[1em]
\text{A: 14日間の値上がり幅の平均} \\[1em]
\text{B: 14日間の値下がり幅の平均}
$$
2日目以降の14日間RSIを求める式(公式2)
$$
\frac{A’}{A’+B’} \times 100 \\[1em]
\text{A’: 14日間の値上がり幅の平均} \\[1em]
\text{B’: 14日間の値下がり幅の平均}
$$
テクニカル分析ABC > 第8回 RSI(Relative Strength Index)
mapAccum関数によってアキュムレータを持ち回りながら
rsiAscend acc / (rsiAscend acc + rsiDescend acc) * 100.0
これを計算するということ。
最初は(公式1)
1
2
| rsiAscend = sum [abs v | v<-diffs, v >= 0] / realToFrac period
rsiDescend = sum [abs v | v<-diffs, v < 0] / realToFrac period
|
次回からは(公式2)
 1
 2
 3
 4
 5
 6
 7
 8
 9
10
11
| let t = case price - rsiLastPrice acc of
x | x >= 0 -> RsiAccumlator
{ rsiAscend = (a + abs x) / realToFrac period
, rsiDescend = d / realToFrac period
, rsiLastPrice = price
}
| otherwise -> RsiAccumlator
{ rsiAscend = a / realToFrac period
, rsiDescend = (d + abs x) / realToFrac period
, rsiLastPrice = price
}
|
1
2
3
| % stack ghci
*Main Aggregate Conf DataBase Lib Model Scraper SinkSlack StockQuotesCrawler TechnicalIndicators TickerSymbol TimeFrame WebBot> TechnicalIndicators.rsi 14 [1000, 1020, 1010, 1030, 1040, 1050, 1080, 1070, 1050, 1090, 1100, 1120, 1110, 1120, 1100, 1080]
[Nothing,Nothing,Nothing,Nothing,Nothing,Nothing,Nothing,Nothing,Nothing,Nothing,Nothing,Nothing,Nothing,Nothing,Just 70.83333333333334,Just 65.0]
|
70.83, 65.0, 合っているんじゃないかな。
MACD(Moving Average Convergence and Divergence)
テクニカル分析ABC > 第13回 MACD(Moving Average Convergence and Divergence)をよく読んでMACD関数を作る。
まず、MACD関数の前に指数平滑移動平均(EMA)関数を用意する。
ema - TechnicalIndicators.hs
 1
 2
 3
 4
 5
 6
 7
 8
 9
10
11
12
13
14
15
16
17
18
19
20
21
22
23
24
25
26
27
| -- | 指数平滑移動平均(EMA)
-- リストの先頭から計算する版
ema :: Int -> [Double] -> [Maybe Double]
ema period prices
| period < 1 = error "期間は1以上でね"
| length prices < period = replicate (length prices) Nothing
| otherwise =
let (seeds, ps) = splitAt period prices in
let seed = sum seeds / realToFrac period in
let na = replicate (period-1) Nothing in
let val = ema' period seed ps in
na ++ map Just val
-- | 指数平滑移動平均(EMA)
-- 種を入力と別々に渡して計算する版
ema' :: Int -> Double -> [Double] -> [Double]
ema' period seed prices
| period < 1 = error "期間は1以上でね"
| otherwise =
scanl formula seed prices
where
--
alpha = 2.0 / realToFrac (period + 1)
--
formula :: Double -> Double -> Double
formula yesterdayEMA todayPrice =
yesterdayEMA + alpha * (todayPrice - yesterdayEMA)
|
EMAを求める式は以下の通り。
EMA = 前日のEMA × (1 - α) + 当日の指数 × α
または
EMA = 前日のEMA + α × (当日の指数 − 前日のEMA)
$$
\alpha = \frac{2}{n+1} \\[1em]
\alpha: \text{平滑定数} \\[1em]
n: \text{平滑期間}
$$
テクニカル分析ABC > 第13回 MACD(Moving Average Convergence and Divergence)
移動平均(MA)といいつつこれは移動平均ではないので、scan関数によって
1
2
3
4
5
6
| --
alpha = 2.0 / realToFrac (period + 1)
--
formula :: Double -> Double -> Double
formula yesterdayEMA todayPrice =
yesterdayEMA + alpha * (todayPrice - yesterdayEMA)
|
これを計算するということ。
短期のEMAと長期のEMAを求めた後にMACDは以下の式で求めます。
MACD = 短期EMA - 長期EMA
テクニカル分析ABC > 第13回 MACD(Moving Average Convergence and Divergence)
macd - TechnicalIndicators.hs
1
2
3
4
5
6
7
8
9
| -- | MACD
-- リストの先頭から計算する版
macd :: Int -> Int -> [Double] -> [Maybe Double]
macd fastPeriod slowPeriod prices =
zipWith (M.liftM2 formula) fast slow
where
fast = ema fastPeriod prices
slow = ema slowPeriod prices
formula f s = f - s
|
- fast
短期EMA - slow
長期EMA - formula
短期EMA - 長期EMA
こんな関数を書いていると、Haskellの関数っていう物は(数学の)関数なんだなと思う。
MACDシグナル(MACDの単純移動平均)
macdSignal - TechnicalIndicators.hs
1
2
3
4
5
6
7
8
9
| -- | MACD signal
-- リストの先頭から計算する版
macdSignal :: Int -> Int -> Int -> [Double] -> [Maybe Double]
macdSignal fastPeriod slowPeriod signalPeriod prices =
let (na, mbvs) = span Mb.isNothing thisMACD in
let vs = map (Safe.fromJustNote "SMAの定義により、中間にNothingは無いはず") mbvs in
na ++ sma signalPeriod vs
where
thisMACD = macd fastPeriod slowPeriod prices
|
上で定義したMACDとSMAを使って定義した。
夕方のバッチ処理
立ち会いが終了して、1時間足が配信されてから収集して集計してテクニカル指標を作る夕方のバッチ処理を用意した。
本来はこの時間に開始するようになっているけれども、利便性のために強制的に外部からバッチ処理エンジンを駆動できるようにした。
使い方
githubからダウンロードして conf.jsonとかの名前で設定ファイルを用意する。(*の所は自分の物を入れておく)
 1
 2
 3
 4
 5
 6
 7
 8
 9
10
11
12
13
14
15
16
17
18
19
20
21
| {
"recordAssetsInterval" : 10,
"sendReportInterval" : 10,
"loginURL" : "https://www.deal.matsui.co.jp/ITS/login/MemberLogin.jsp",
"loginID" : "********",
"loginPassword" : "********",
"dealingsPassword" : "*******",
"userAgent" : "Mozilla/5.0 (Windows NT 10.0; WOW64; rv:50.0) Gecko/20100101 Firefox/50.0",
"slack" : {
"webHookURL" : "*****************************************************************************",
"channel" : "#*******",
"userName" : "********"
},
"mariaDB" : {
"host" : "localhost",
"port" : 3306,
"user" : "********",
"password" : "********",
"database" : "stockdb"
}
}
|
それからシェルで
1
2
3
| % stack build
% stack install
% tractor --batch
|
–batch付きで強制的に外部からバッチ処理エンジンを駆動する。(立ち会い時間中に動かすと、今日の確定していない株価がデーターベースに入るから注意)
初回起動時はこれでテーブルを作って終了する。(mariaDB上のデーターベースはすでにある物とする。ここでは”stockdb”が有る物とする)
テーブルが出来たら"portfolio"テーブルのtickerに、例えば"TSNI225"とかを入れる。これは日経平均株価のティッカーとここで定義した。他はNULL値でOK
とすると今度は収集と集計とテクニカル指標を作る作業を開始するので終わるまで待つとデーターベースに結果が入る。
mariaDBサーバーにアクセスして結果を取り出す
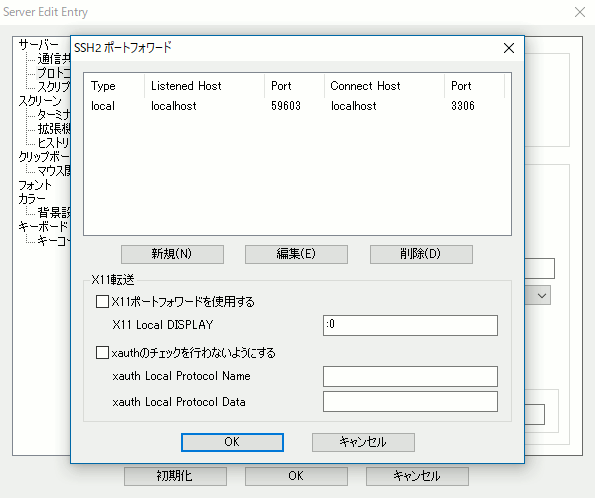
サーバーのport3306(MySQL / MariaDB)は開けてないので、Rloginでポートフォワードして接続します。
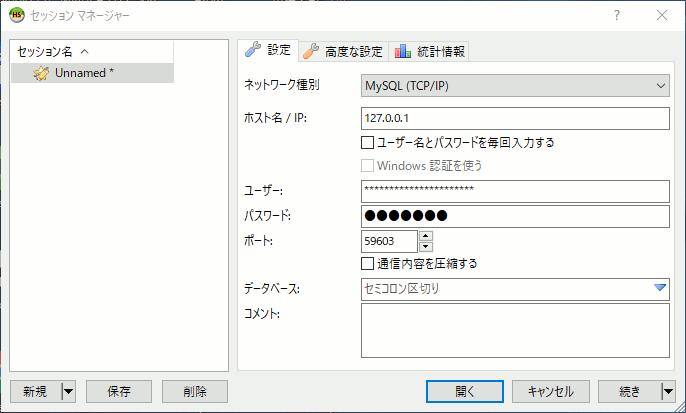
mariaDBクライアントはHeidiSQLをつかっているので、こう設定してRloginでフォワードしたローカルのポートごくろうさんにつなげばリモート側の3306とつながる。